Network Monitoring and Video Diagnostics
Python monitoring and map dashboards for availability and video-stream problems on a large ITS network with little existing monitoring.
Outcomes
- Python checked switches every 15 minutes at approximately 80 buildings and at field sites selected for maintenance, outages, and restoration.
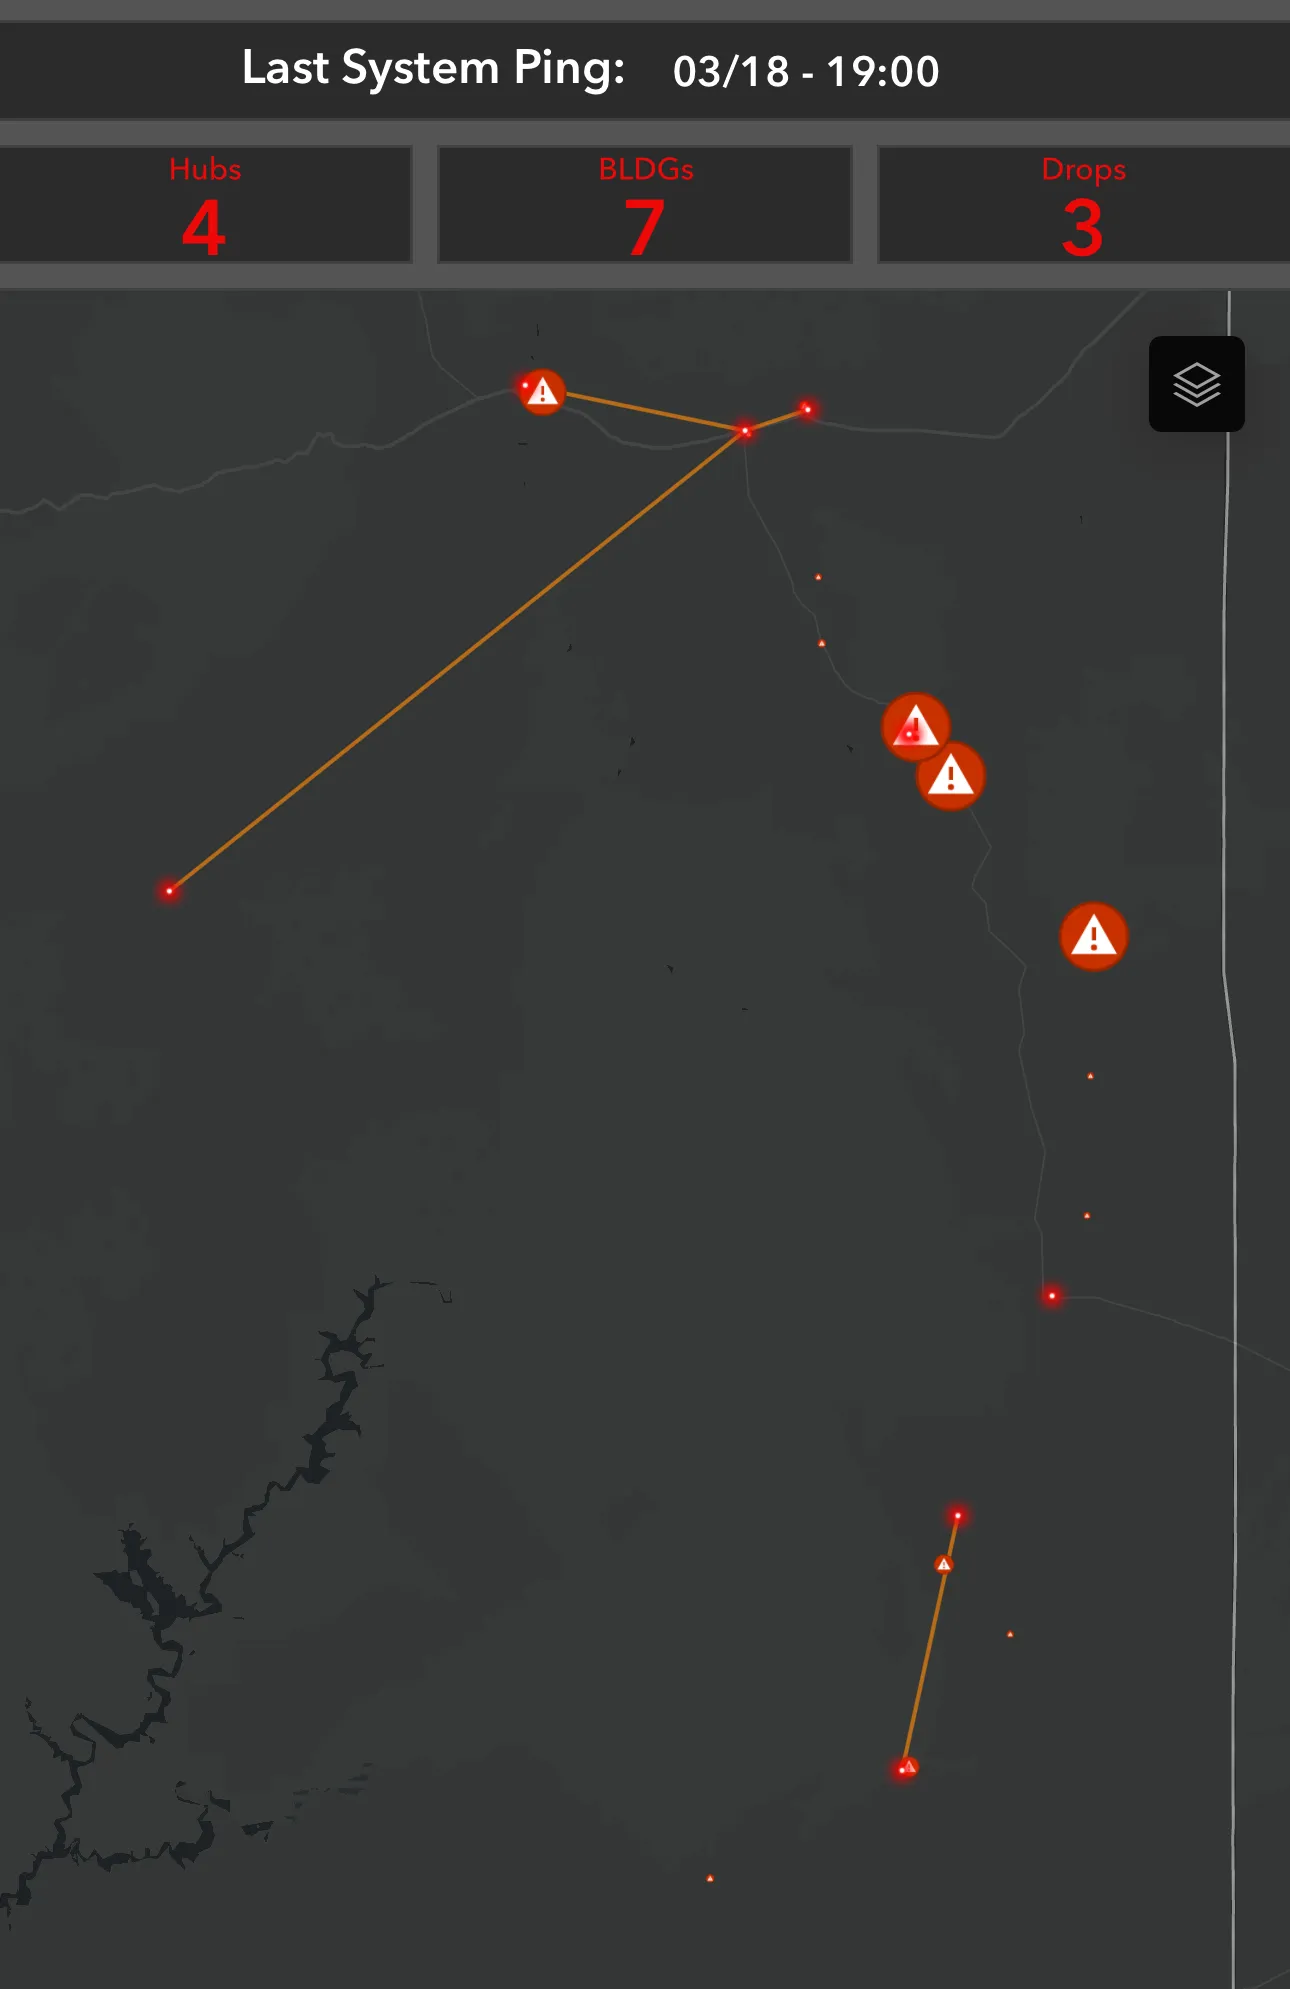
- ArcGIS Online showed results in red and green, so staff could see outages without testing each switch.
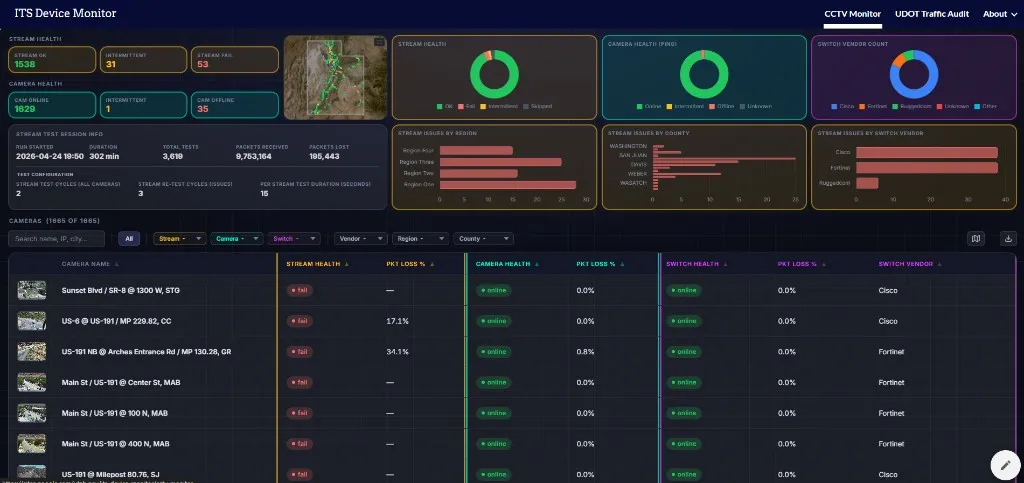
- A second workflow sampled nearly 2,000 camera streams. Ping showed reachability. RTP measurements showed video-delivery problems, next to the switch vendor.
The client had no network operations center and no practical way to monitor field devices. Software access and deployment options were limited, so the tools had to work inside those constraints.
Network availability mapping
Python checked switch reachability every 15 minutes at approximately 80 buildings and at selected ITS field sites. The field list could be updated for planned maintenance, outages, and restoration.
Results went to a spreadsheet synced through Google Drive. A published CSV fed ArcGIS Online, where red and green symbols showed the latest status. Office staff and field crews shared one view of outages and restoration instead of testing switches one by one.
Multicast video diagnostics
A second workflow investigated video problems tied to one switch vendor. Deployment records were incomplete, so the tool also had to find where those switches were installed.
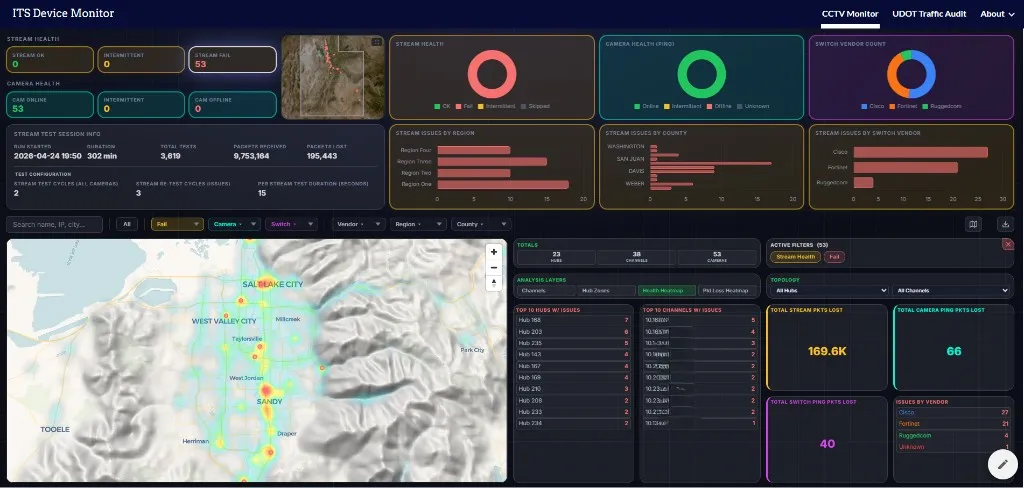
SNMP identified the vendor. Ping tested the switch and the camera. Multicast sampling evaluated the video. RTP sequence numbers and arrival timing produced packet counts, estimated loss, duplicates, out-of-order packets, the largest gap, and bitrate.
The run covered nearly 2,000 cameras. Samples typically lasted 15–25 seconds. Each cycle tested the full list, then retested flagged streams before the next cycle. Repeats were configurable, typically two to five per flagged camera. A Google Apps Script dashboard showed tables, graphs, and a map.
Ping showed whether a device answered. The stream sample showed whether the video was getting through, alongside the switch vendor. Those results located problem sites and helped make the case for a fuller monitoring system.